Showing posts with label Google Data Studio. Show all posts

Wednesday, November 10, 2021

Update on Google Data Studio #4 - It's all about sharing!

Bonjour everyone! I was originally going to white about my journey in sharing my students' writing work thanks to Google Data Studio. However, after having seen how popular my latest report had been with my class and school community in general, I changed my mind...

Over the past couple of weeks, I have been thinking a lot about how I could implement further the Manaiakalani's LearnCreateShare pedagogy. As a matter of fact, I have found that it can sometimes be a struggle over distance learning, seeing as how most of the students' work is shared over email by their whānau. I realised that I was really missing having the option to share my students' learning around our classroom, like we would normally do.

As we all know, I have a strong passion for making sure that our learning is connected, ubiquitous and visible. However, ever since Auckland went back into lockdown last term, I have found a challenge in making sure that our learning also made my learners feel empowered. Even though my students have had the opportunity to choose between different learning activities, they have been a little stuck with how their sharing would happen. With my students having to rely heavily on their whānau and on the people in their bubble to share their work with me, some students have been missing out on sharing their mahi, while some have only been sharing their work during our online meetings. There were not a whole lot of choice options available for them at that stage, and many had expressed how frustrated they have been feeling in that regard.

From the moment lockdown started, I realised that this would be an issue for a number of students. I had done some thinking at the time, and realised that some of their work (such as most maths activities, our reading log, and some writing work) could easily be sharable using Google Forms. This was a big success, and many students enjoyed seeing their individual as well as their peers' mahi thanks to the various Google Data Studio reports that I created, all thanks to them being able to share their work with me by themselves. So this was a step in the right direction, but was it really going to be enough? What about those learners who would rather use paper as their prefered way of learning? Or those who would rather record themselves in video? If their whānau was unavailable to help them share their mahi, then they still felt excluded.

In my opinion, sharing is not just about learners showing their work to their kaiako. Rather, I see sharing as an opportunity to share our mahi with at least our class and school community, if not to a wider audience. Unfortunately, individual emails did not enable us to achieve this goal. I wanted more. I wanted to find a way to make Room 2's students' hard work (as well as their well-earned feedback!) visible for everyone. I will, of course, still be replying to emails - this will not change in the slightest! 

As you might have figured out by now, I have been working on yet another project to share more of our learning journey. This little passion-project of mine has taken some time to be what it is now, and there has been a lot of finetuning to make it as engaging as I would have wanted it to be. From now on, every time a student shares their work with me via email, I will make sure to also add their mahi to this virtual portfolio, for eveyone to have a look at. This report is linked to a Google Form, which enables students to upload their mahi themselves if they wish to (if not, I will upload their work on their behalf). Children will have the chance to say a few words to present their mahi if they would like to, and they will also be able to access their feedback without having to ask parents for access to their mailbox. I've set it up so that it's kind of like hanging our work around the classroom, only in a virtual way. I have also added a couple of graphs to it (mostly because my students are really enjoying these, let's be honest, and also because it helps with keeping them engaged)I have also added a filter so that viewers can either browse through all of the students' mahi, or so that they can directly look for a specific student's pieces of work.

In the end, this is the final version of this project, where my students can share the create activities that they have done throughout their learning journey:

My learners have also been learning to add their work to our class padlet by themselves. They no longer need me to upload their work for them and have been leaving some lovely comments underneath their classmates' posts. 

Made with Padlet

Distance learning is not my favourite way of teaching, but I do have to acknowledge how far we have come. Learners and teachers alike have had to upskill themselves and most seised the opportunity to learn how to use new tools that they would not have become familiar with otherwise. I am really amazed by all the digital skills everyone has developed throughout the year, and I am confident that these are skills which we will be able to use once we go back to face-to-face instruction

Wednesday, October 27, 2021

Update on Google Data Studio #3 - Room 2's clever mathematicians term 3

The life of someone alone in their bubble can get quite repetitive and (dare I say?) almost boring at times. To keep myself occupied over the past 70+ days, I have gone back to exercising, done a bit of furniture refurbishing, and tried to improve my drawing skills. But my brain also needed some creative/ down/ fun/ challenging time, and so I have done my fair share of exploring with Google Data StudioI have not been the best at posting though, so I will try to update my professional blog over the next couple of weeks... Stay tuned!

After having created a reading log for my class (which they are still loving and using daily), I thought that I needed something to keep my students engaged with their maths learning. During one of our online meetings, I asked my students how we could make this more fun for them while they are learning at home, and what they would like to see more of. As a general consensus, they all talked about how much they would like to see how many maths activities had been done by who, and which ones had been the most popular. So I put my brain to work, and tried my best to do create some sort of a maths log.

However, with the wide variety of maths Google Forms activities available on our class site, this one took some creative thinking to get right. I have been using many different google forms for our maths activities, which means that I had to come up with a way of utilising the data from a lot of different tas within the same spreadsheets. This was a little trickier to set up and took more time, but he is what I have come up with so far:

This one will not update itself automatically for now as I am still tweaking a few bits and bobs on it, but it also includes the work that my students have sent me via email.

I am looking forward to seeing what else I could add to this, but I think I will leave this to next term for now... I can already confirm that my learners are really enjoying looking at our maths display, and they have requested I make them another one for term 4... Stay tuned for more updates on how I have been using Google Data Studio to display my students' writing over this extended lockdown period!

Friday, September 17, 2021

Digital Fluency Intensive - Week 6 blog post

Being home by yourself is no easy task, and I have to admit that I tend to avoid being faced with my loneliness by finding new projects to work on and creating new activities to keep my students engage. And as a result, it is possible that I might have forgotten to update my professional blog, again. Thank you, Phil, for reminding me!

This week was our sixth session of the Digital Fluency Intensive course for term 3 - this session's focus was enabling access.

During this session, I really enjoyed looking at different class sites across different age groups. It made me realised that was might be working for me this year in a year 2 class might not necessarily be working as well if I were to move to a higher year level at some stage. It also helped me reflect on what was working well with my site, and what needed to be improved.

However, I thought that the criteria we used to assess and give feedback on each other's sites might be a little subjective. As I was thinking before, different year levels will have different needs, and what might work in a class might not work in another class of a similar level. At the end of the day, I strongly believe that whatever it is that works best for your learners is what you should be focusing on as an educator. It does not mean that what one is using is perfect and shouldn't change. On the contrary, I think that if you start asking yourself the right questions, you might be able to improve the experience of the users who will be navigating the site. Instead of focusing on what you would like to see, why don't you ask your learners/ users what they need and want? Personally, I know that I loved getting feedback from my learners at the start of this term, it really helped me improved the way my site looked and it helped me make it easier for junior students to navigate. That being said, certain things will be true regardless of year level or personal preferences. Anyone (especially students!) would get discouraged by spending too much time looking for where their activity is located, whether it be because they had to click on too many links or whether they had to scroll for too long to get to the aforementioned activity. 

Regardless, I loved being able to look more in depths as the sites of my bubble group. We gave and received feedback on what our sites looked like at that point of the session, and then it was time for us to pick goals for us to work on, before our create session began.

This week's create session: enabling access (Google sites)

At first, I had my heart set on reorganising bits and bobs on my class site. But as I thought more about how I could improve it, I realised that it might not be the best choice with us being in lockdown. Our class site is working really well as it is, students are familiar with it and able to navigate it without any support. If I were to change it, I would rather do it in term 4 when we are back in the classroom and I can teach my students how to use the updated version.

As a result, I  decided to create little mini-sites for my t-shaped units (before this session, my t-shaped units were all part of my main class site,  but I realised that this was probably not as ideal as I originally thought it would be).

There will, however, be no "before and after" pictureWith my students being familiar with how to use the links that are currently available on our site, I have decided not deleted those, but I thought that there had to be an easier for me to share these sites with the rest of my team. I then decided that this was not enough, so I ended up creating an extra google site to link all the multi-modal sites I have already created this year, including a link to the template I am using to create these sites. Here is the link in case you would be interested in checking them out - just be aware that some are still under construction.

During today's session, I also managed to finish a new multimodal site, this time integrating a report from google studio which will update itself every time students (or special guests!) fill in our google form with their pepeha. I've added another section this time, in order for other people to fill in their pepeha as well (support staff, family members, students from other classrooms or other schools, etc. If you are interested in checking out what the final result is, I invite you to check out our Te Wiki o te Reo Māori site


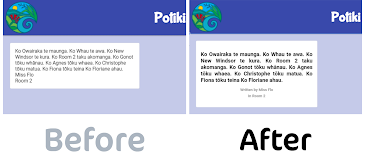
I couldn't help but feel sad for not having had the opportunity to have a good before and after photo montage. I know that this wasn't really the aim of this session, but I couldn't help myself to have just a little bit of a play with Google Data Studio. I thought that using cards would be a good way to display students' writing, but in the end, I wasn't entirely convinced of the way it looked. But then, my world opened up once I realised I could use my basic knowledge of HTML and CSS to improve the way it looked and adjust it to fit my needs. I am feeling pretty happy with the results, but I might try and see if I can improve this further later on. My students have been telling me that these reports are really motivating them to submit their work, so I know I will be putting in an extra effort to create these sorts of reports whenever I can.


Unfortunately, my internet connection was impacted by the DDOS attack: I was left unable to keep on having fun with today's create session. I will have to update our class' padlet in my own time to make our sharing more visible... Stay tuned, or head to our class blog for more updates on this. Regardless, I thoroughly enjoyed this DFI session, which was more hands-on, as I found the opportunity to work on our class sites really useful (especially with Auckland still being in lockdown for now).

Thursday, September 2, 2021

Update on Google Data Studio #2 - Reading log page 2

Soooo. It is possible that I might have done a thing, again.

I've been playing with Google Data Studio a lot over the past week (wait, has it really only been a week?! Time really does fly, don't you think?), and I can tell you that it definitely is my ultimate favourite Google tool.

As much as I enjoyed creating my original report to display my students' reading log data, I felt like something was missing and I was convinced that there was more I could do. And so I did.created an extra page to display my students' individual reading log data. For this second page, I wanted to create something more relevant to my learners and their whānau, but I also wanted something that would make it easier for me as a teacher to track my students' learning.

Check it out:

I ended up coming up with the idea of using a drop-down list based on the names of my students. I then set up the report so that the user would be able to click on the name of the student they are interested in. This will then populate how many books have been read, which books have been enjoyed the most, as well as their most recent book review. Before selecting the student's name, the report will display the data for the whole class.

I find Google Data Studio super fun to use, although it does get a little addictive. I would still recommend you to check it out if you are interested, I would love to see what you come up with!

I have also created a brand new report, this time about maths. But I do not want this blog post to get too long, so I think that I will leave it there for now... Stay tuned!

Wednesday, August 25, 2021

Self learning - Google Data Studio #1

If you know me at all, you are well aware of my love and passion for spreadsheets. Colour coding, formulas, graphs, pivot tables... You name it! But if you know me, you also know that I love a good challenge. I just simply cannot stay still. My brain needs to always be working in the background, one way or another. With New Zealand being back into lockdown, I've had to find new ways to keep myself busy and entertained.🧠

Everyone knows how much I love spreadsheets and pretty graphs, but I felt like I needed a new challenge to keep me entertained over this new lockdown. I had been thinking about using Google Data Studio for a while now, but I did not find enough time to give it a go.

With the country's swift move back to alert level 4, the students in room 2 and I have been working hard on our distance learning programme. Not all my students have access to their own devices, so I've been using google forms to try and keep most of my students engaged and get them to share their learning without always needing them to ask their parents to email me their work. It's been working really well, especially our reading log, but I didn't feel super happy with what sharing looked like given that I was the only person having access to that data...

As much as I love a good spreadsheet, my year 2 students really don't - which is why I wanted to create something different that they could access too. So I made the most of being stuck at home: I started teaching myself how to use Google Data Studio, and I figured out a way to display the data that I have been collecting with our class reading log.

I love the final result because it visually appealing to students, and also (let's be honest!) mostly because it will update itself automatically every time one of my students fills in our reading log.

Look at this, how cool!

I mean, it is still very much a work of progress. I would love to be able to add a filter for us to pick which Room 2's book review we want to read, but I haven't gotten that figured out quite yet. This should keep me busy over this lockdown! 🤭

My students' favourite feature is the 'most recent book review', which they can see changing quite frequently throughout the day as more people fill in the form.

I can really feel myself falling in love with this tool already. I might be slightly obsessed, but I do feel like the possibilities are only limited by one's creativity and immagination. If you're already confident using Google Sheets, I would highly recommend giving it a go.

Next steps:

  • I'll be creating more of these to showcase our learning, but I'm wondering if anyone else out there uses Data Studio to display their students' learning journeys?
  • I am SO looking forward to attending a toolkit on Google Data Studio with Dave walker this Wednesday evening to find out more about this tool. Stay tuned...